![]() Support reactions [kN] are represented as arrows or a diagram (ruled by layer settings). In the drawing the size of the arrow is related to the size of the support reaction, taking into account the size of the force.
Support reactions [kN] are represented as arrows or a diagram (ruled by layer settings). In the drawing the size of the arrow is related to the size of the support reaction, taking into account the size of the force.
Field of support reaction vectors bundled to the nodes of FEM:
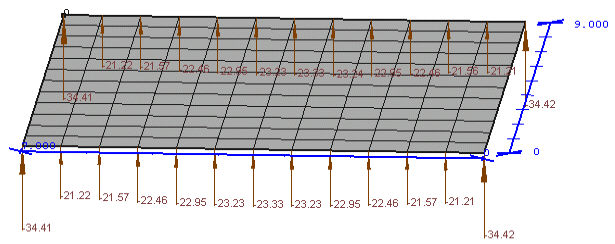
Diagram (line/area) with the extreme reactions:
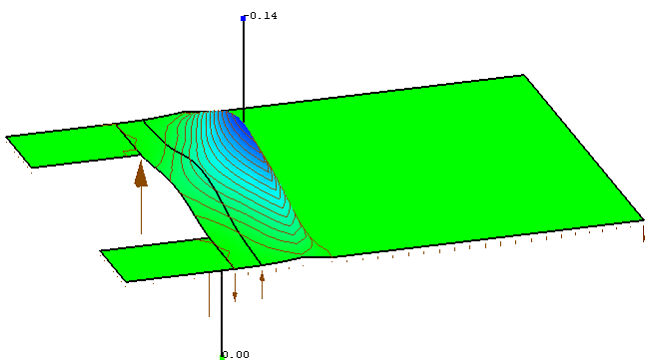
![]() Soil pressure [kN/m3] is presented as isolines, which can be shown in the 3D visualization by moving the mouse cursor, with the left mouse button pressed down, in the floor field.
Soil pressure [kN/m3] is presented as isolines, which can be shown in the 3D visualization by moving the mouse cursor, with the left mouse button pressed down, in the floor field.