When calculating χLT according to EN 1993-1-1 6.3.2.3, the user can adjust the delta value, which determines whether the diagram can be interpreted as linear. If the moment diagram does not align with any of the diagrams listed in Table 6.6, it undergoes a second analysis using the delta value. If all moment values are found to be within the specified delta range, then k꜀ is calculated using a formula containing the ψ value.
Use case:
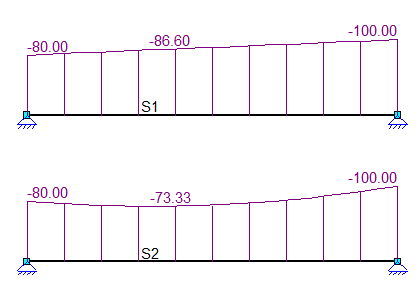
In the illustration below, two instances using moment diagrams are shown. The member S1 displays a linear moment diagram, allowing the calculation of k꜀ using a formula containing the ψ value. However, the moment diagram of the member S2 does not match any of the diagrams in EN 1993-1-1 6.3.2.3#Table 6.6. Initially, the delta value is converted from a percentage to an absolute value by multiplying it with the maximum edge moment, in this instance max (-80, -100). The diagram is then analyzed to ensure that all points fall within the calculated delta. Upon comparing the nonlinear diagram of S2 with the linear diagram of S1, the largest delta is determined as -86.6 – (-73.33) = 13.27 kNm. Assuming the entered value in the settings is 10%, the maximum allowed delta becomes 10 kNm. In this scenario, the diagram cannot be interpreted as linear, hence the default value of k꜀ = 1 is used. However, if the setting is adjusted to 15%, the maximum allowed delta increases to 15 kNm, allowing linear diagram interpretation. Then, k꜀ is computed using ψ = (-80)/(-100) = 0.8, yielding a result of k꜀ = 0.938. A table summarizing calculations with several delta values is displayed below.
Delta, % | Delta, kNm | Delta calculated, kNm | Interpret as linear | ψ | k꜀ |
0% | 0 | 13.27 | ✗ | 0.8 | 1 |
10% | 10 | ✗ | 1 | ||
15% | 15 | ✓ | 0.938 |

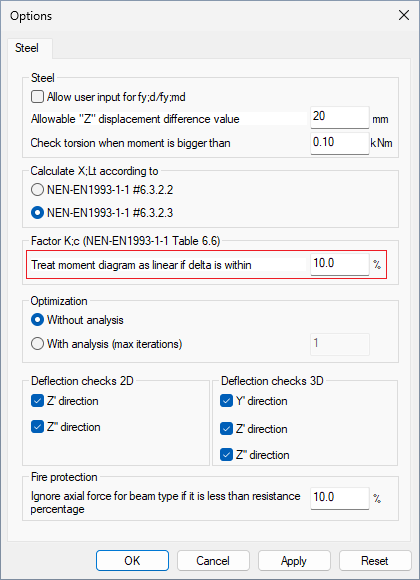
The optional parameter of the Delta [%] value using MatrixFrame® can be adjusted:

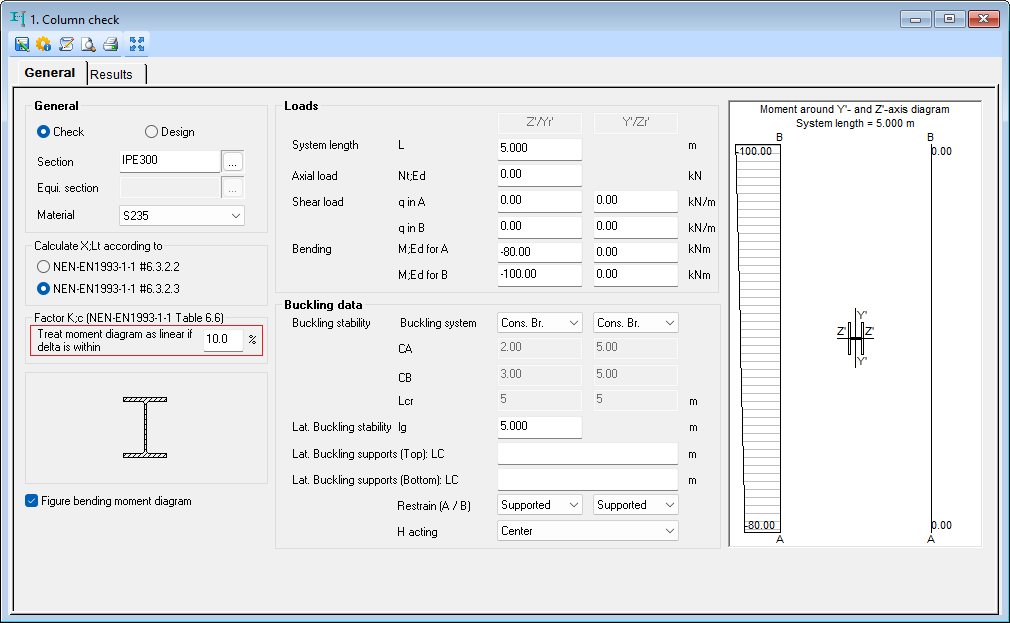
The optional parameter of the Delta [%] value using MatrixTools® can be adjusted:
