Results
The results of the mechanical analysis are available:
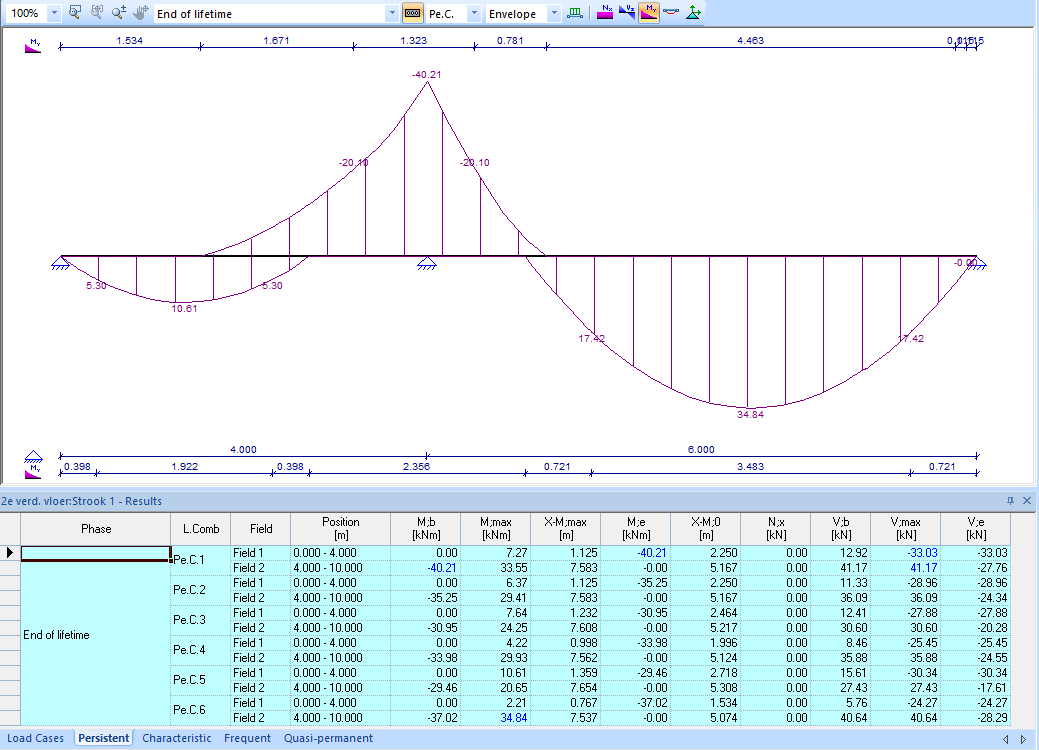
- Numerical: tables with the numerical values of the forces.
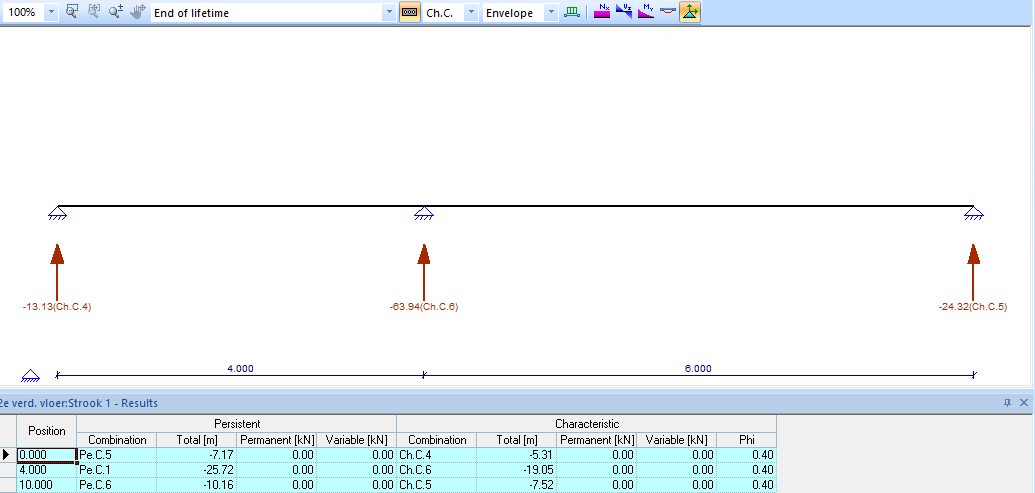
- Graphic: graphs showing the course of the forces, deformations and support reactions.
1. Example of the numeric display:

- Tabs: At the bottom of the table you can choose from different tabs for displaying the results of the Load cases or of the Persistant, Accidental, Characteristic, Frequent or Quasi-permanent results. By clicking on a value, the corresponding graph for the normal forces, the bending moments or the shear forces is displayed.
- Phase: The results can be viewed by phase. The number of stages available depends on the number defined during the input.
- L.Comb: Indication of the relevant combination + serial number.
- Field: the results are shown per field. The relevant field is listed in the table with a serial number.
- Position: the start and end position of the field [m]
- M;b: moment at the beginning of the field [kNm]
- M;max: maximum field moment [kNm]
- X-M;max: position of the maximum field moment [m]
- M;e: moment at the end of the field [kNm]
- X-M;0: position of the moment zero [m]
- N;x: normal force [kN]
- V;b: shear force at the beginning of the field [kN]
- V;max: maximum shear force in the field [kN]
- V;e: shear force at the end of the field [kN]
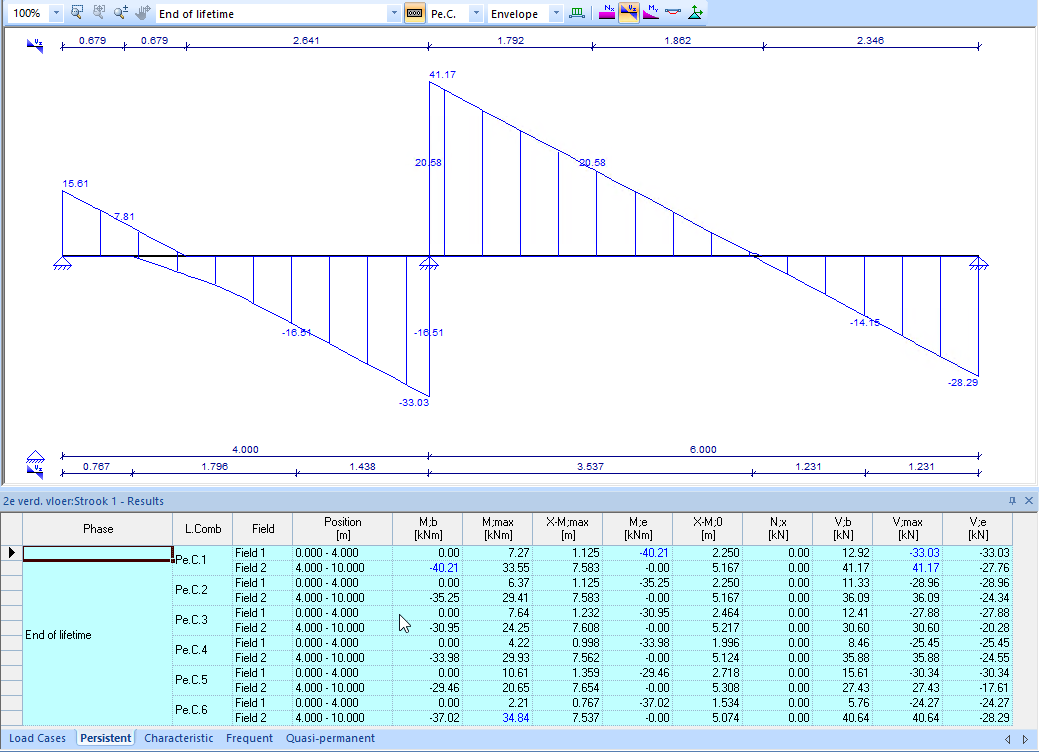
2. Examples of the graphical representation of the results of a formslab calculation:
- Envelope bending moment diagram:
- Envelope shear force diagram:
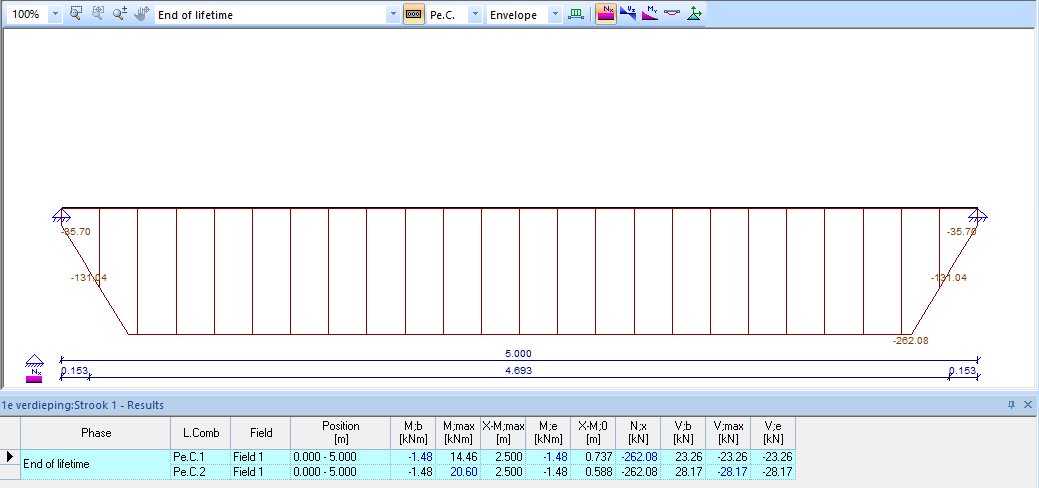
Examples of the graphical representation of the results of a prestressed hollow core slab:
- Normal force diagram due to the prestress:
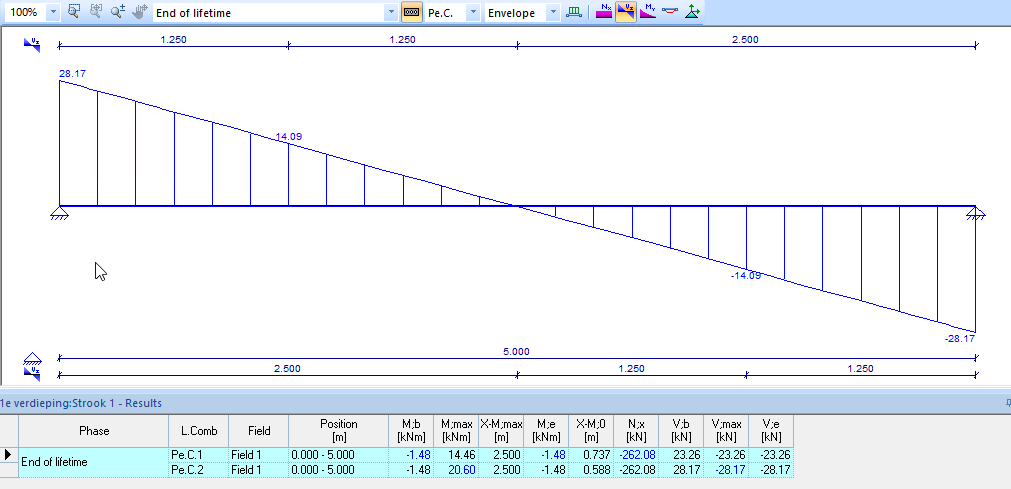
- Shear force diagram:
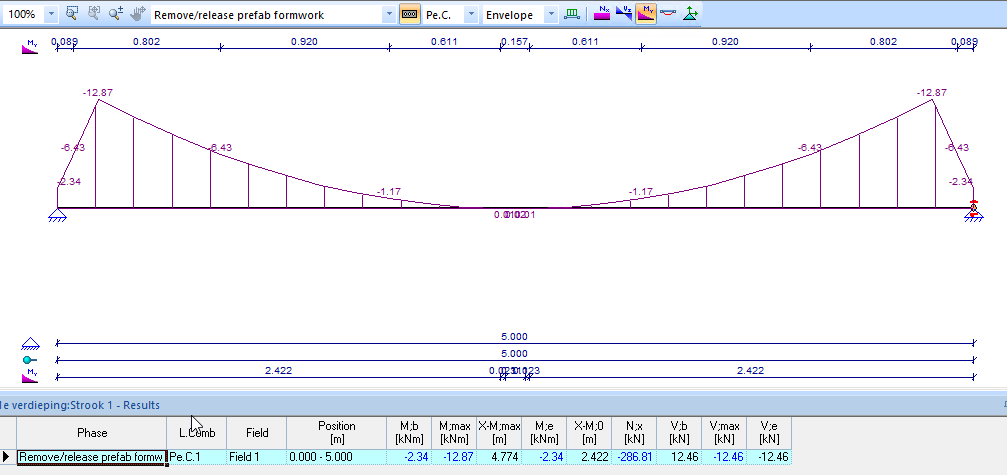
- Bending moment diagram (remove/release prefab formwork phase):
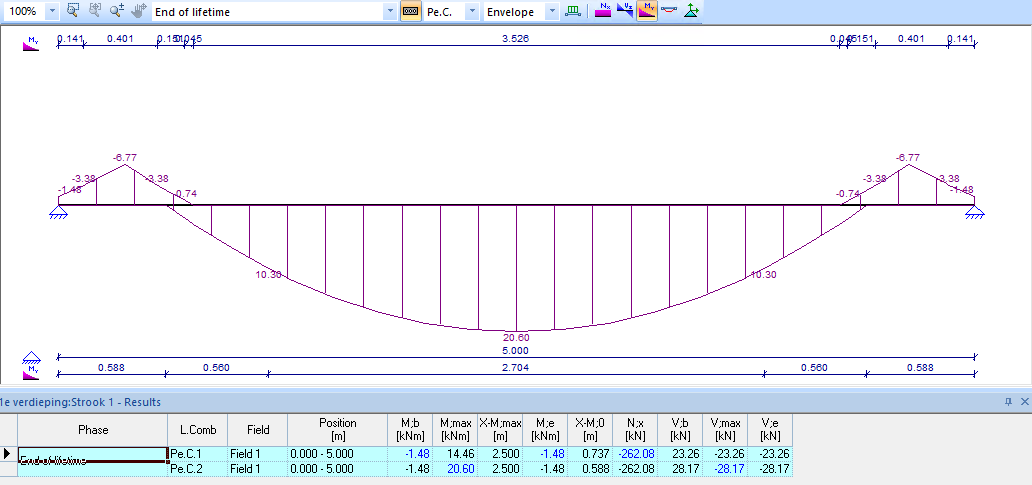
- Bending moment diagram (end of live time phase):
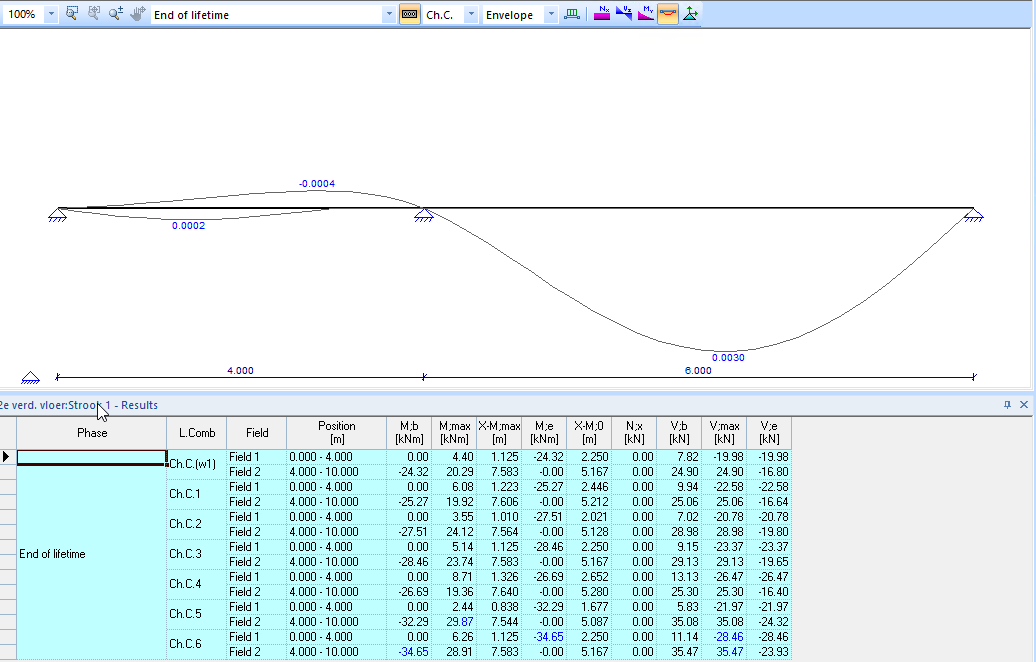
- Deflections diagram (envelope):
- Support reactions diagram (envelope):
