The determination of the required reinforcement in the x- and y-direction, at the bottom and top is based on the calculated reinforcement, taking into account the data from basic reinforcement. The results are represented in isolines in top view or in the dynamic 3D visualization.
When calculating the required reinforcement the minimum reinforcement is taking into account according to the article 9.9.2.1 from the NEN6720 (NEN-EN1992-1-1#9.2.1.1(1)).
A shift of lever arm and reinforcement moment as a result of minimum reinforcement:
|
The horizontal part is calculated with Mr, on the left side with 1.25‧Md and on the right with Md |
The effective width in the graphical output of required lever arm:
without the basic reinforcement |
with the basic reinforcement |
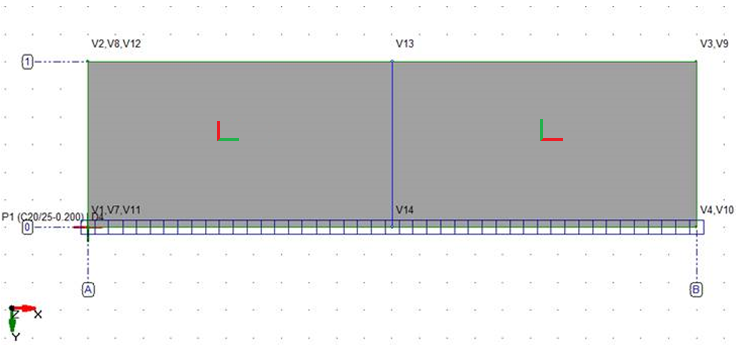
There is a possibility to display a reinforcement grid on top of a plate. The grid consists of the cells combined of 4 intersecting lines defining the position of reinforcement values, as follows:
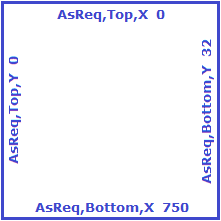
The top reinforcement is displayed on the top side (X-direction) and left side (Y-direction), the bottom reinforcement - on the bottom side (X-direction) and right side (Y-direction).
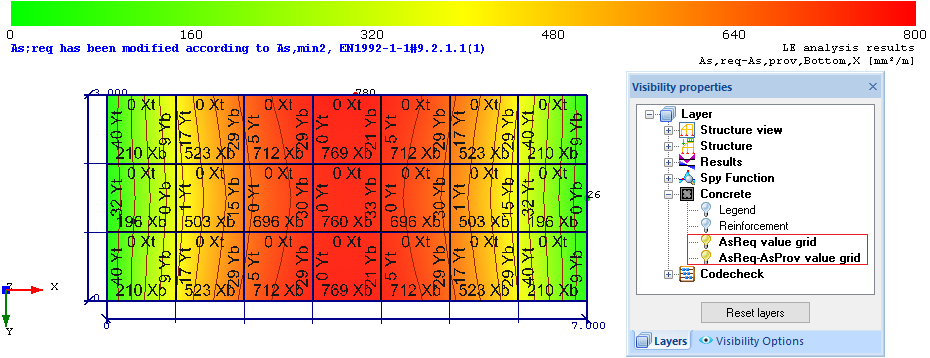
There are 2 options to make a visualization of As;Req and/or As;Req - As;Prov reinforcement values grid in “Visibility properties” by activating the appropriate layer(s):
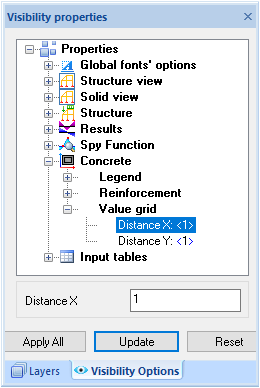
The size of the reinforcement grid could be changed in “Visibility options” by managing values “Distance X” and “Distance Y” defined in meters:
The values inside the grid cells can be calculated in several ways with different calculation accuracy and speed, depending on the setting in “Options” -> “Concrete” -> “FEM” -> “Value grid calculation accuracy”:
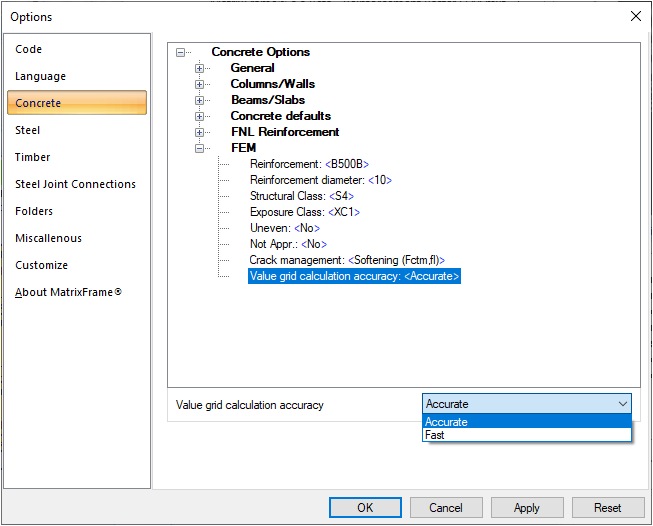
| Fast | Accurate |
|
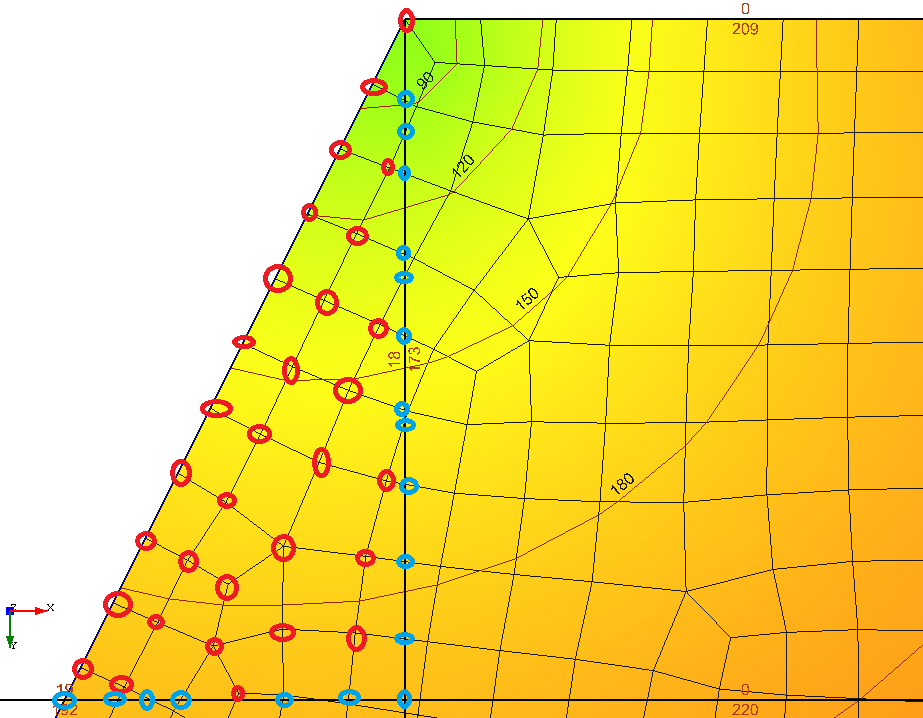
Calculation of values (vertices) that are inside the cell (marked in red) including intermediate values on mesh elements, that are crossed by the edge of the cell (marked in blue). The procedure is quite fast, but the accuracy might suffer as it will greatly depend on the density of the mesh and size of a cell. Also the additional tests on geometry and calculation of intermediate values on the edges of meshed elements are performed |
Calculation of values (vertices) that are inside the cell (marked in red) including intermediate values on mesh elements, that are crossed by the edge of the cell (marked in blue), and including area around each vertex as a weight in average calculation algorithm. The procedure is much slower, although it will give the most accurate result. |
 |
|
Every As;prov-As;req value grid cell is represented in the global coordinate system, while the value itself is representing local situation (reinforcement placement in the local zone), where:
- Value of 910 is representing As;prov-As;req mean value inside the grid cell on the top of the structural element in the local X’ direction (red).
- Value of 0 is representing As;prov-As;req mean value inside the grid cell on the bottom of the structural element in the local X’ direction (red).
- Value of 66 is representing As;prov-As;req mean value inside the grid cell on the Top of the structural element in the local Y’ direction (green).
- Value of 2 is representing As;prov-As;req mean value inside the grid cell on the bottom of the structural element in the local Y’ direction (green).
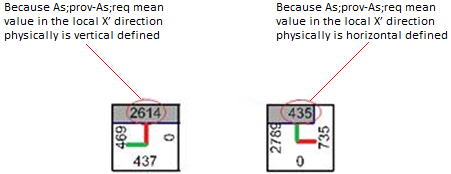
The above described assumption can be confusing by investigating results in different local zones for the almost physically symmetrical situation, like:
where As;prov-As;req mean values inside the grid are represented as:
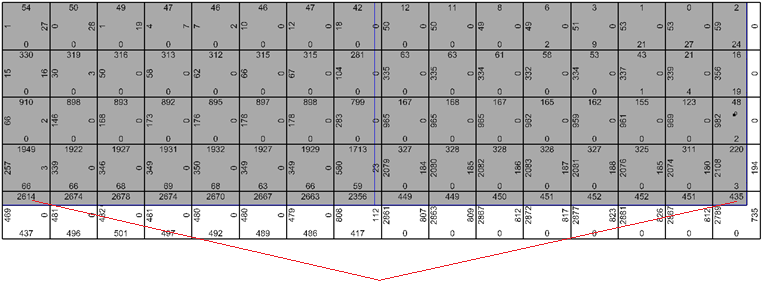
Why 2614 >>435 in the almost physically symmetrical situation?
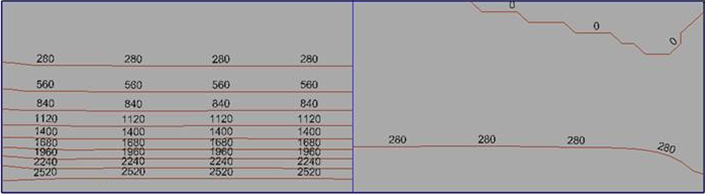
Similar redistribution of As;prov-As;req using isolines is represented as: